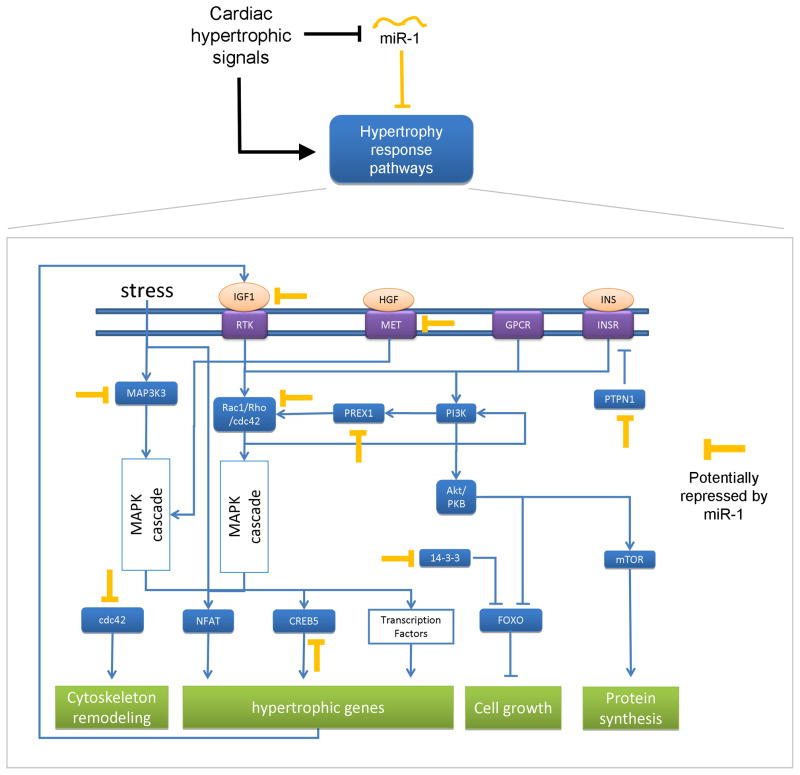
Figure 2. miR-1 and PIP3 signaling in cardiac hypertrophy.
The orange repressive arrows depict high-quality putative targets of miR-1 in the PIP3 pathway in cardiac myocytes (see Experimental Procedures). The rest of the network is based on known interactions compiled from the literature (Heineke and Molkentin, 2006). See Figure S1 for network diagrams of other selected predictions discussed in the text.

