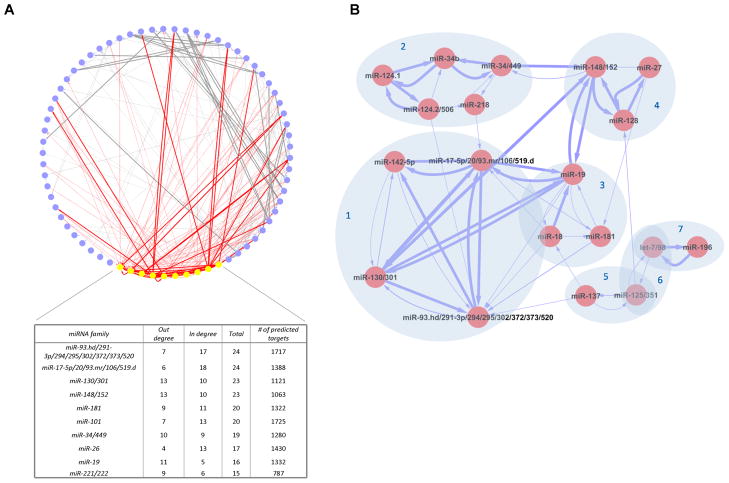
Figure 3. The miRNA-cotargeting network inferred by mirBridge.
The thickness of the edges is proportional to −log (q). (A) The ten most connected nodes and the adjacent edges are highlighted in yellow and red, respectively. (B) Examples of highly interconnected subnetworks. See also Figure S3.

