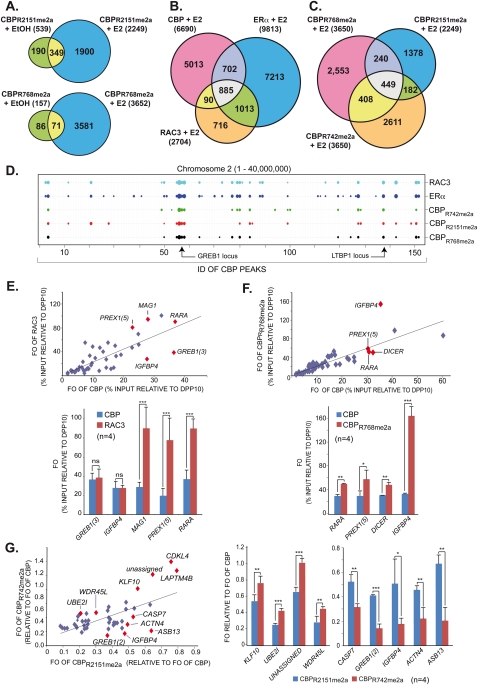
Figure 5.
Differential global estrogen-induced recruitment patterns of methylated CBP species. (A) Venn diagrams displaying pre-existing and de novo generated chromatin-binding sites in H3396 at global scale for CBPR2151me2a and CBPR768me2a after 1 h of estrogen or vehicle treatment. (B) Venn diagrams as in A revealing E2-induced recruitment of CBP, ERα, and RAC3 to common and divergent binding sites. (C) Venn diagram as in B illustrating the recruitment of CBPR768me2a, CBPR2151me2a, and CBPR742me2a to common and divergent binding sites upon E2 treatment. (D) ChordChart representation of binding patterns for the indicated factors at chromosome 2 (1–40,000,000 bp). The X-axis comprises the cumulative CBP IDs of consecutive peaks along the chromosome. Peaks for the different factors are represented by weighted dots according to the number of tags generating a peak. Binding sites at GREB1 and LTBP1 are indicated. (E) Scatter plot (top panel) derived from ChIP-qPCR validations (bottom panel) of E2-induced binding sites identified by ChIP-seq displaying FOs (relative to DPP10 site 1) of CBP relative to those of RAC3 at multiple loci, some of which are indicated; only ERα-binding loci were considered. (F) Scatter plot as in E but revealing divergent FOs of CBP and CBPR768me2a (relative to DPP10 site 1) at E2-induced ERα-binding sites. (G) Differential recruitment of methylated CBP species to individual ERα target genes. Scatter plot (left panel) derived from ChIP-qPCR validations (right panels) for E2-induced ERα-binding loci. The scatter plot displays normalized FOs for CBPR2151me2a relative to CBPR742me2a. FOs for the meCBP species were normalized relative to the FOs of bulk CBP at the same site, thereby taking into account variations of total CBP binding. Statistically significant differences are shown: (*) P < 0.01; (**) P < 0.001; (***) P < 0.0001.

