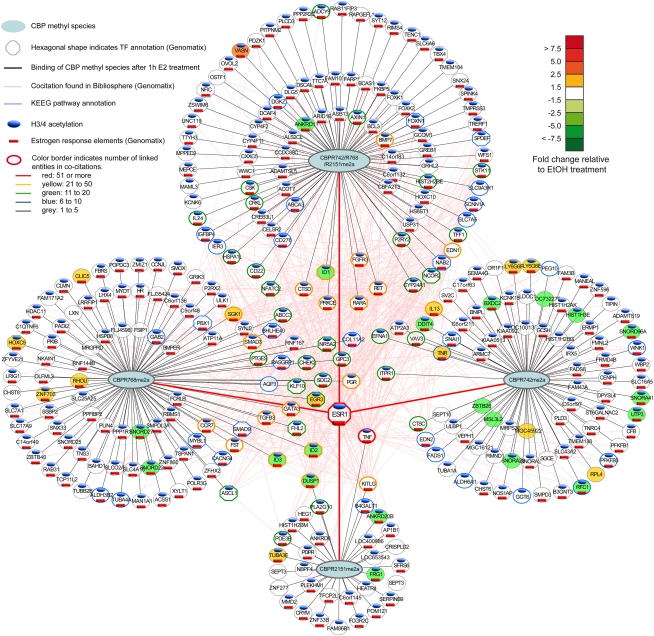
Figure 7.
Illustration of the ER-meCBP regulon and its functional status 1 h after estrogen treatment. A comprehensive illustration of the regulon up to 24 h after treatment and of the pathways in which the various ER targets are involved is shown as a Supplemental PowerPoint file. The regulon was constructed by crossing transcriptomics profiles at 1, 2, 6, and 24 h after estrogen induction (only genes with >1.5-fold changes of expression were considered) with the ChIP-seq data at 1 h, considering genes in 10 kb vicinity of meCBP binding sites. The four hubs comprise regulated genes that bind either all three meCBP species simultaneously or only one of the three species alone. Note that, in the case of triple species binding, it is not possible to distinguish between three separate meCBP molecules and a single CBP bearing all three methyl tags. Within the regulon, TFs are indicated as well as the regulation status (color-coded), the presence of histone acetylation in the vicinity of the TSS, and the presence of EREs (codes are specified in the figure). The connectivity of the various genes in the ER-meCBP regulon was derived from cocitation analysis and is depicted by the color of the gene circle according to the code given in the figure. This connectivity is illustrated by lines connecting the various genes, and places most of the TFs in the center of the regulon.

