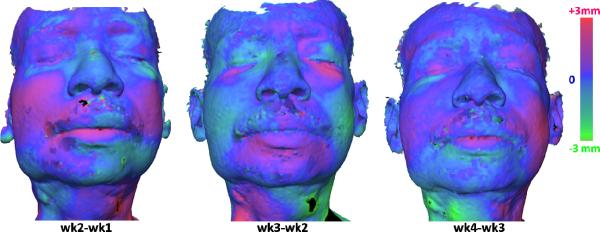
Figure 8.
Results of longitudinal assessment of edema using profilometry on the face. The color rendering shows the distances between the surfaces obtained from two consecutive weeks, (a) week 2 compared to week 1, (b) week 3 compared to week 2, and (c) week 4 compared to week 3. Increased edema is presented in magenta and decreased edema is presented in green.

