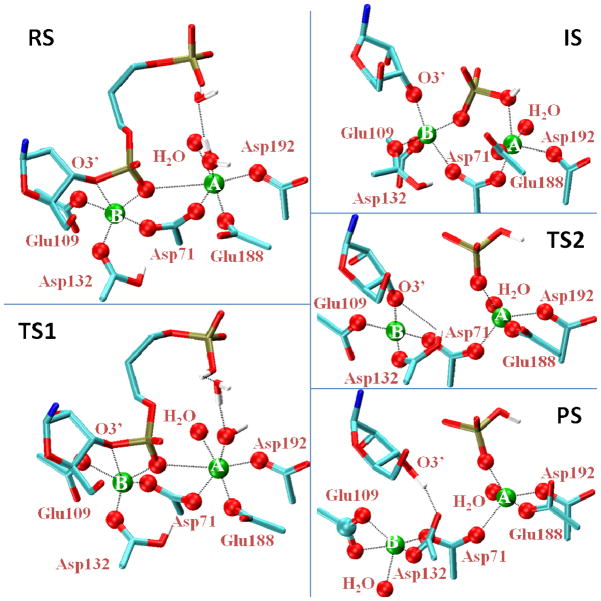
Figure 5.
Representative structures along the catalytic reaction of RNase H using protonated Asp132. The reactant state and first transition state are shown on the left (top to bottom), with the intermediate state, second transition state, and product state on the right. The downstream phosphate is only shown for the initial reaction steps (left). Dashed lines indicate select interactions. Oxygen atoms (red) within 2.6 Å of the Mg2+ ions A or B (green) are shown as spheres.

