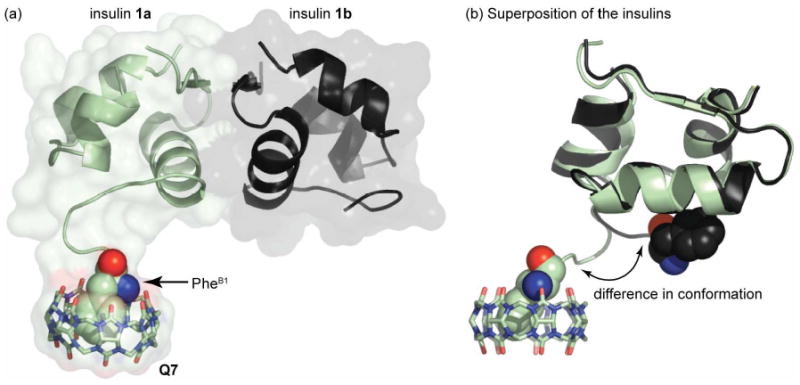
Figure 3.

Crystal structure of the Q7• 1 complex. (a) Asymmetric unit of the crystal, with the two molecules of insulin, 1a (green) and 1b (black), rendered as ribbons and the associated Q7 as sticks. The solvent-accessible surface is shown as semi-transparent to reveal the overall shape of the complex. The PheB1 position of 1a, which is bound inside Q7, is rendered as space-filling, with carbon in green, oxygen in red, and nitrogen in blue; the N-terminal nitrogen is the blue sphere. (b) Superposition of the two insulins illustrates the strong homology between 1a and 1b with clear divergence at the N-terminus of the B-chain. In this image, the PheB1 position of both insulins is rendered as space-filling for comparison.
