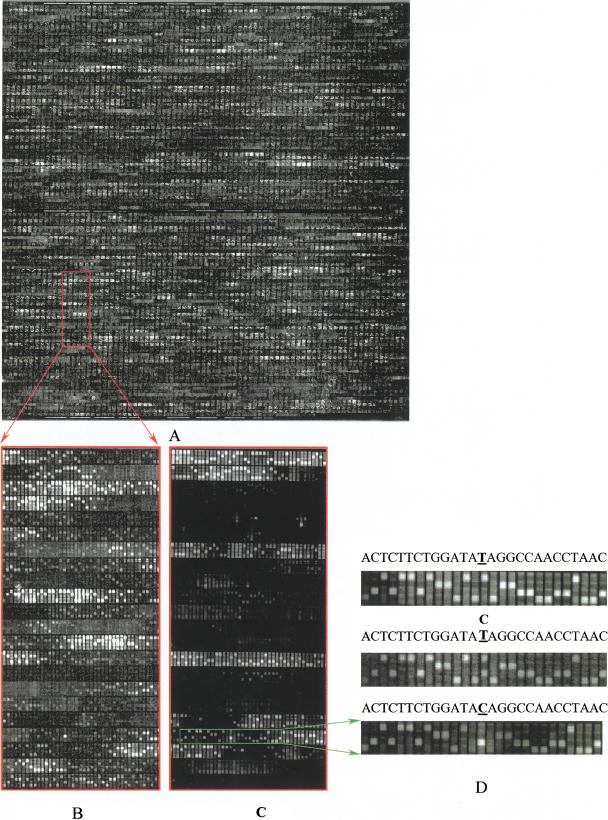
Figure 2.
SNP screening with variant detection arrays (VDAs). (A) The whole image of 40 pM targets hybridized with VDA. (B) An expanded view of a portion of A. (C) The same region of image as in B except that the chip was hybridized with enriched targets. (D) A single nucleotide polymorphism (SNP) detected and confirmed by alternative sample preparation. From top to bottom, the wild type (base T at the center), heterozygous SNP (bases C and T at the center), and homozygous mutation (base C at the center) are shown.

