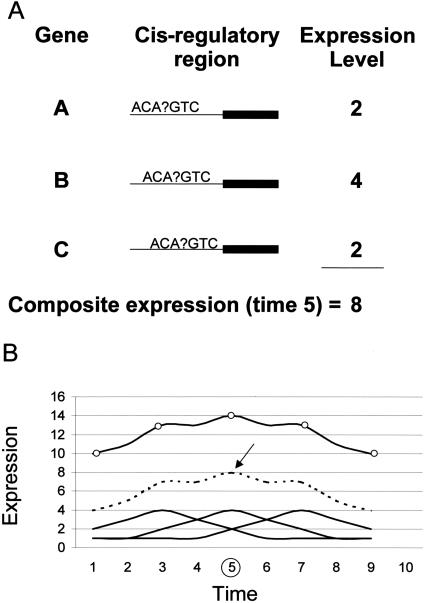
Figure 1.
The method for correlating a transcription factor with a regulatory motif is based on creating a composite expression of genes for each putative cis element. The regulatory region of all expressed genes are scanned and each frame of a given size (in this case seven) is regarded as a potential cis element. (A) At each time point, a composite expression pattern is generated by adding the expression value of genes carrying a given motif in their regulatory regions (in this case, the summation for ACA?GTC is shown at time 5 where ? can be any base). (B) A series of time points is analyzed and, systematically, composite expression patterns based on potential motifs are compared with the expression of each transcription factor. The expression patterns of genes with ACA?GTC in their promoters, shown as solid lines, is summed to create a composite expression pattern, the broken line directly above. Transcription factor expression, depicted as a solid line with circles, is shown to correlate well with the composite pattern. The best correlations are considered the best transcription factor-binding site hypotheses.

