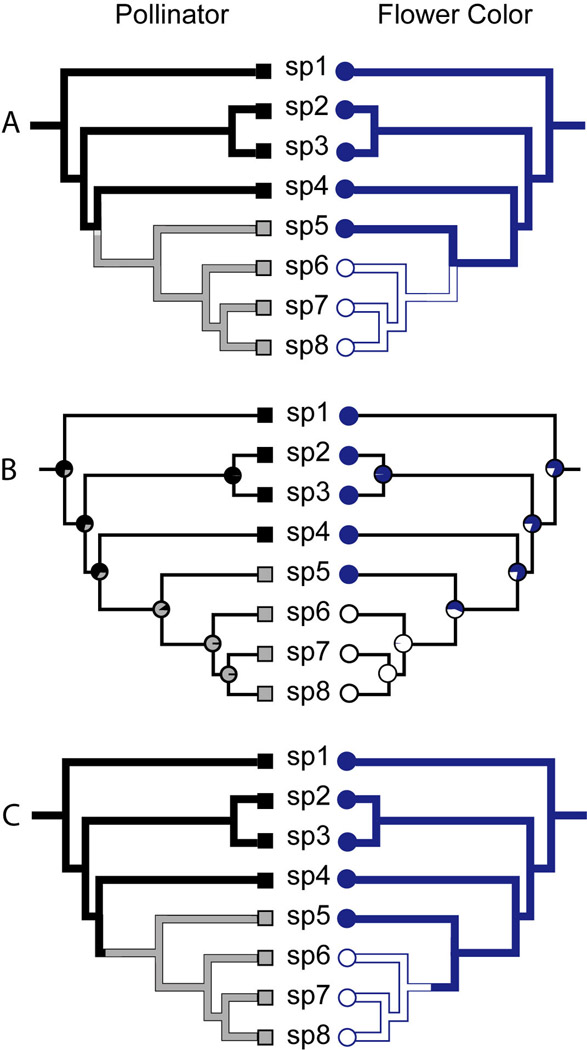
Fig. 2.
Comparison of ancestral state reconstruction methods. As in Fig. 1, there are two states for pollinator, bee pollination (black squares) and moth pollination (gray squares), and two states for flower color, blue (dark circles) and white (open circles). The characters states for each tip follow Fig. 1A. (A) Parsimony reconstruction with branches “painted” to show ancestral states. Trait changes are localized to nodes by convention. (B) Maximum likelihood reconstruction with pie charts at each node showing the relative probability of each state. (C) A single stochastic mapping realization for each character. The location of the color shift indicates the exact position of change along the branch during the realization. Note that multiple realizations of character history would be needed to obtain an estimate of the number and position of changes in each character.

