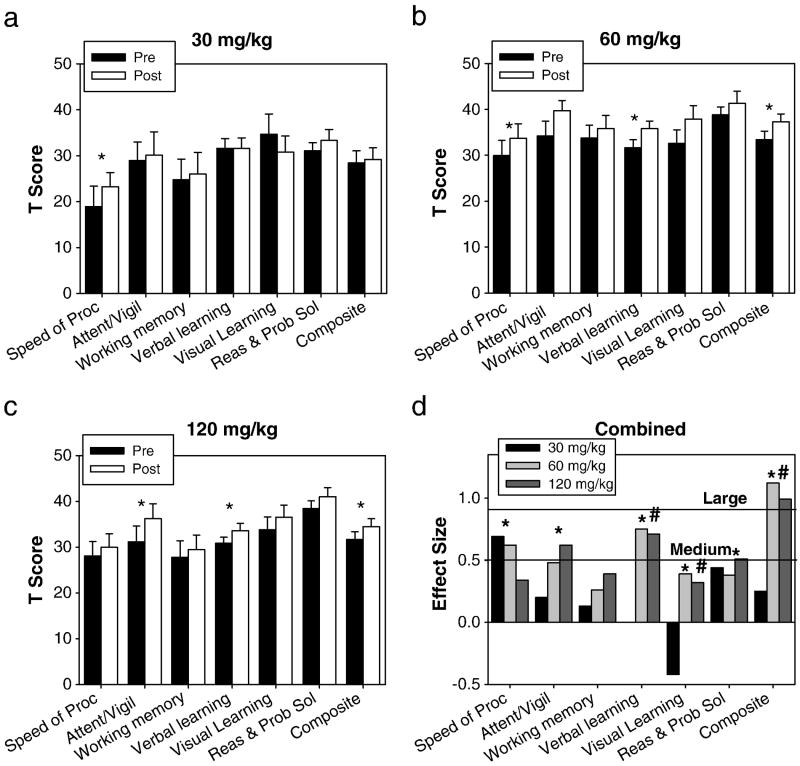
Figure 2. MATRICS Outcomes.
Baseline (filled bars) and final (open bars) normalized MATRICS domains and overall mean composite (mean T-score of six tested domains) for (a) 30, (b) 60, and (c) 120 mg/kg. d. Within group effect sizes for each dose. *p<0.05 in a paired t-test between baseline and final (a–c) or on a paired t-test for doses >60mg/kg (d). #Significant (p<0.05) dose by time interaction for 30 vs. ≥60 mg/kg.

