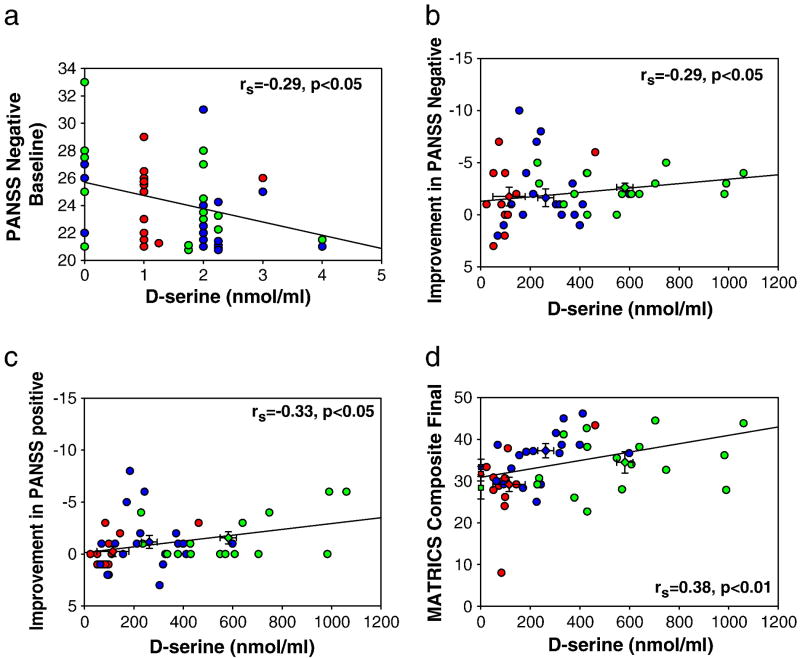
Figure 4. D-serine Pharmacodynamics.
Regression scatter plots of D-serine plasma level vs. behavioral outcome. Circles
 indicate an individual patient, diamonds
 and
and
 indicate final and baseline mean±SEM, respectively. a. Pretreatment D-serine level vs. pretreatment PANSS negative. As PANSS scores are reported as whole numbers, circles were vertically offset to avoid superimposing subjects. b and c. Peak D-serine level on Day 1 of treatment vs. improvement in (b) PANSS negative, (c) PANSS positive. d. Peak D-serine level on Day 1 of treatment vs. post-treatment MATRICS composite.

