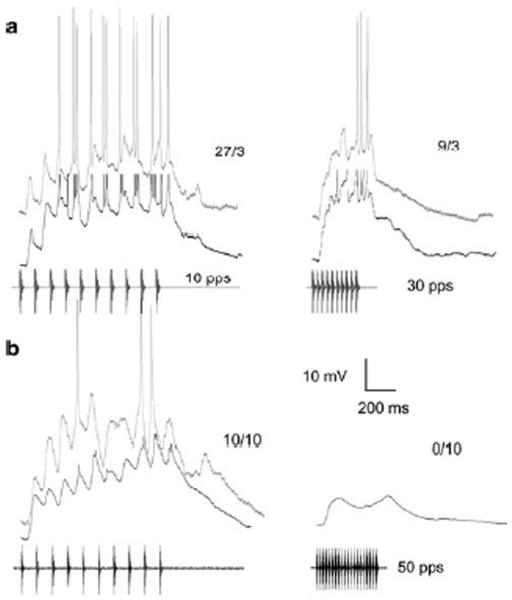
Fig. 4.
Responses of two representative neurons that showed temporally summating depolarizations without apparent inhibition or rate-dependent enhancement of excitation. In this and subsequent figures, responses from individual cells are arranged in a row and denoted by a particular label e.g., a, b, c. Responses of each cell to optimal PRR (10 pps) are shown in the left column. Responses to 30 pulses/s (a) and 50 pulses/s (b) are shown in the right column; the latter stimulus consisted of 20 pulses. The number of spikes elicited over the number of stimulus (pulse train) presentations is shown above each trace. Black traces = averaged responses; gray traces = responses to single presentation of each stimulus. a: Resting potential, −48 mV; carrier frequency = 150 Hz, the BEF of the neuron; stimulus amplitude = 75 dB SPL; recorded from H. regilla; PRR tuning function, filled squares figure 3a.. b: Resting potential = −76 mV; carrier frequency = 300 Hz (BEF); 57 dB SPL; recorded from R. pipiens; PRR tuning function, dashed line, figure 3c

