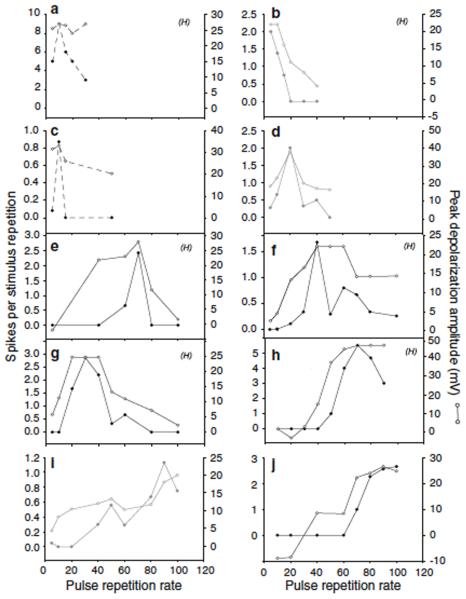
Fig. 7.
Spikes per stimulus presentation (left axis, closed symbols) and depolarization amplitude (mV) (right axis, open symbols) vs. pulse repetition rate for 10 neurons. Line types are coded as described earlier: data shown as dashed lines are from neurons that showed temporal summation and lacked inhibition. Other data are from neurons that showed inhibition and either prominent (gray) or small (black) depolarizations to pulses presented at slow rates e.g., cells of the types shown in figures 5 and 6, respectively. Neurons recorded from H. regilla are denoted by an (H), those from R. pipiens are unmarked.

