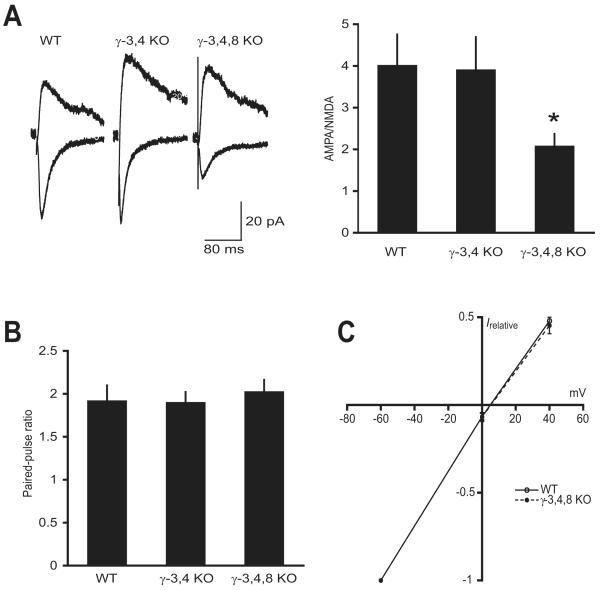
Figure 1. AMPA receptors in hippocampal CA1 pyramidal neurons from WT, γ-3,4 KO and γ-3,4,8 KO mice.
A, AMPA/NMDA ratios were calculated by dividing the peak amplitude of EPSCs evoked at −60 mV by the amplitude of dual-component EPSCs evoked at +40 mV at 150 ms after the stimulus artifact, by which time the AMPA receptor-mediated component had entirely decayed. Traces at left are from representative experiments, and the graph at right shows summarized data. *P < 0.05 compared to WT and γ-3,4 KO.
B, Summary of paired-pulse ratios, calculated by dividing the amplitude of the second EPSC by the amplitude of the first (interval 50 ms).
C, Summarized current-voltage relationship of AMPA-mediated EPSCs recorded in AP-5 (50 μM), normalized to the peak amplitude at −60 mV.

