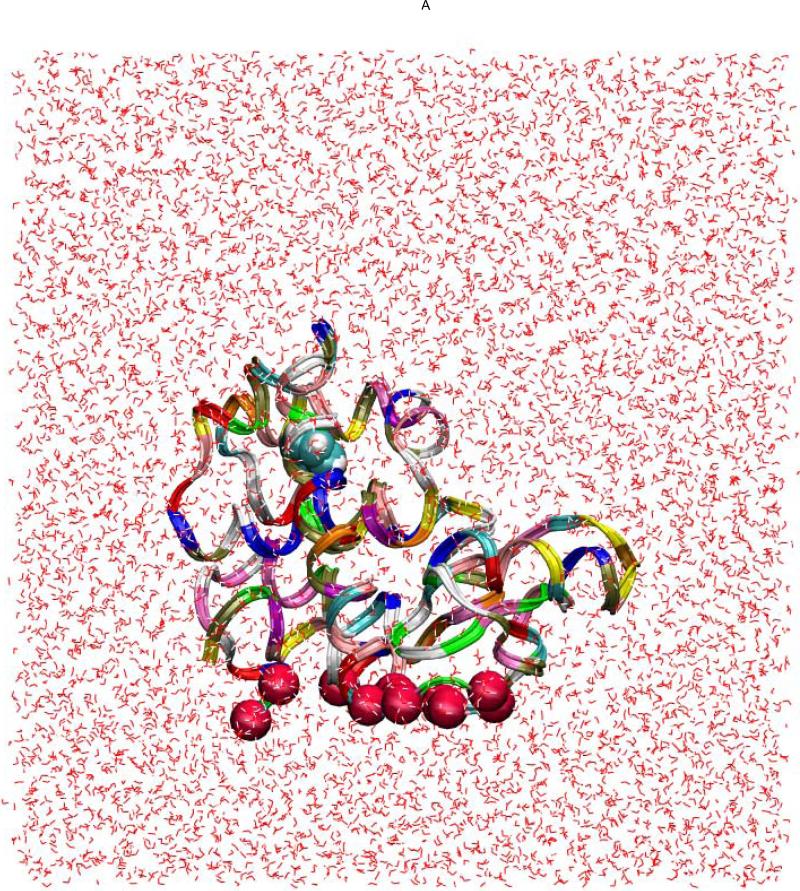
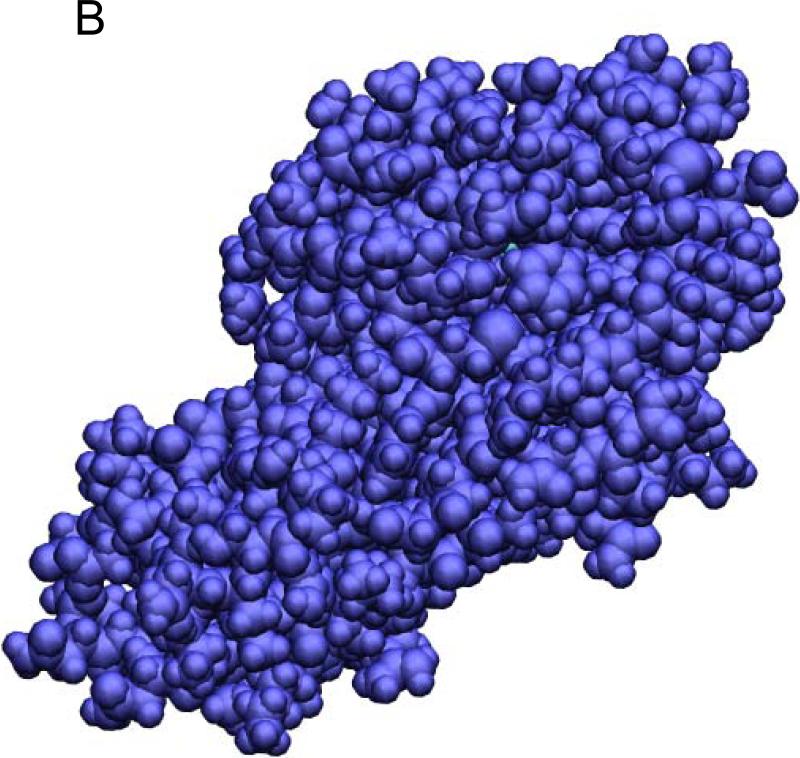
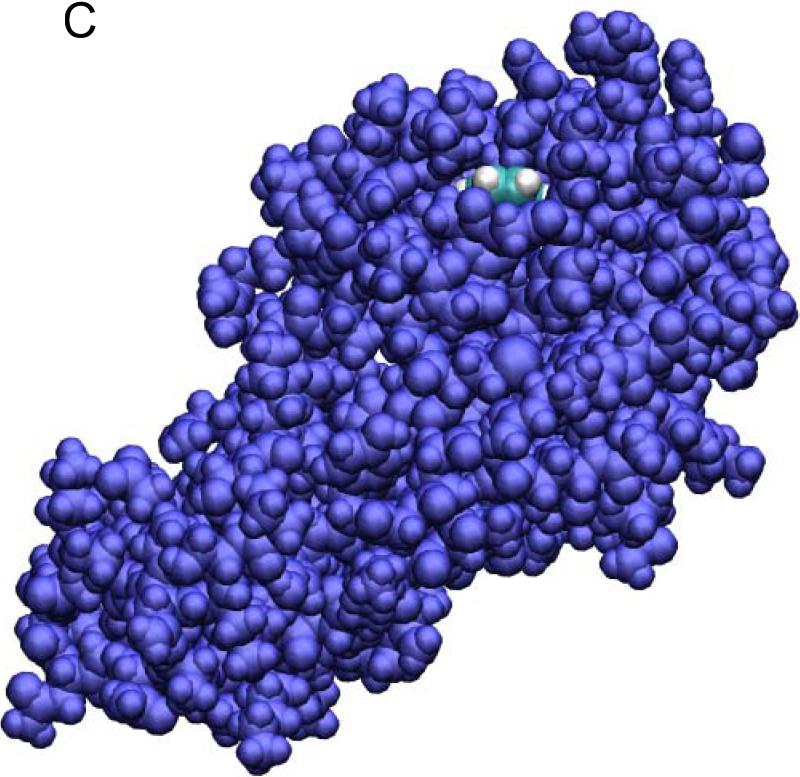
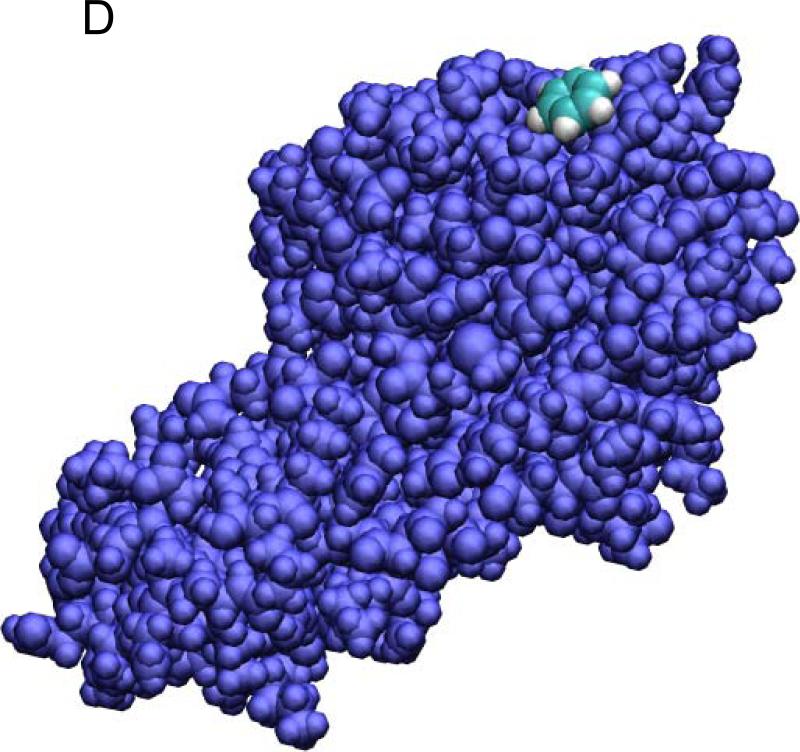
Fig. 4.
The benzene-T4L system in the bound state (A, B), the transition state (B), and the dissociated state (D). Shown in (A) are the waters (red lines), the benzene (in VDW representation), and the protein (in ribbon representation). The red spheres indicate the alpha-carbons of the bottom part of the protein that are fixed during the SMD simulations. Note that the z-axis is vertically up in (A) but no so in (B) to (D) where the views are rotated to better illustrate the relative positions of benzene (carbon in blue and hydrogen in white) and the protein (purple) both in VDW representations. All drawings were rendered with VMD.51


