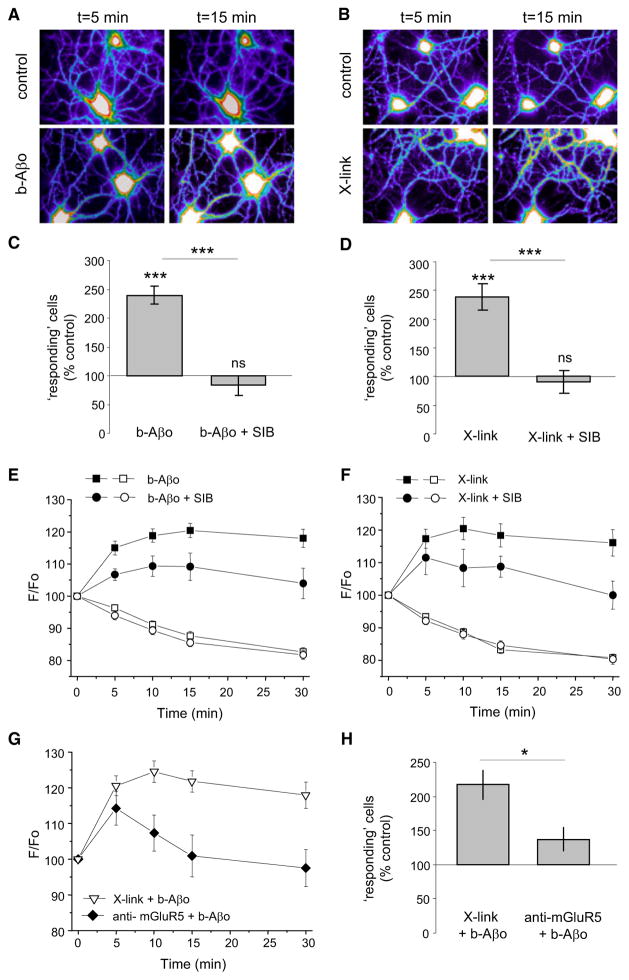
Figure 8. Aβ Oligomers and Crosslinking of mGluR5 Impact on Intracellular Calcium.
Ca2+i monitored by fluorescence intensity of Fluo4AM on neurons treated with Aβo (A, C, and E) or after mGluR5 crosslinking (B, D, and F). Mean ± SEM.
(A and B) Examples of cells (Fluo4 intensity in pseudo-color).
(C and D) Percentage of “responding” neurons (that increased Fluo4AM intensity during the recordings) over control conditions. (C) Neurons treated with Aβo (500 nM) or Aβo and SIB (Aβo + SIB; t test, ***p > 0.0001; n = 16–22 fields of observation). (D) Neurons after mGluR5 X-link or after X-link and SIB (t test, ***p > 0.0001; n = 15–34 fields of observation).
(E and F) Fluo4AM fluorescence intensity over time (F/Fo; mean ± SEM) of cells where the intensity increased (“responding”; black symbols) or not (“not responding”; white symbols). (E) Cells treated with Aβo (circles) and with Aβo + SIB 1757 (squares) (n = 21–105 cells). (F) Cells after X-link of mGluR5 and without (circles) or with SIB 1757 (squares) (n = 27–127 cells).
(G and H) Neurons were treated for mGluR5 cross-linking and with Aβo (500 nM; X-link + Aβo) or they were incubated with an anti-mGluR5 antibody prior to Aβo application (anti-mGluR5 + Aβo). (G) Fluo4AM fluorescence intensity over time (F/Fo; mean ± SEM) of responding neurons treated with mGluR5 X-link + Aβo (black triangles) or with anti-mGluR5 antibody + Aβo (white triangles) (n = 44–62 cells). (H) Percentage of responding neurons treated as in (G) (percentage over control conditions; t test, p = 0.030; n = 10–20 fields of observation).

