
Figure 2.
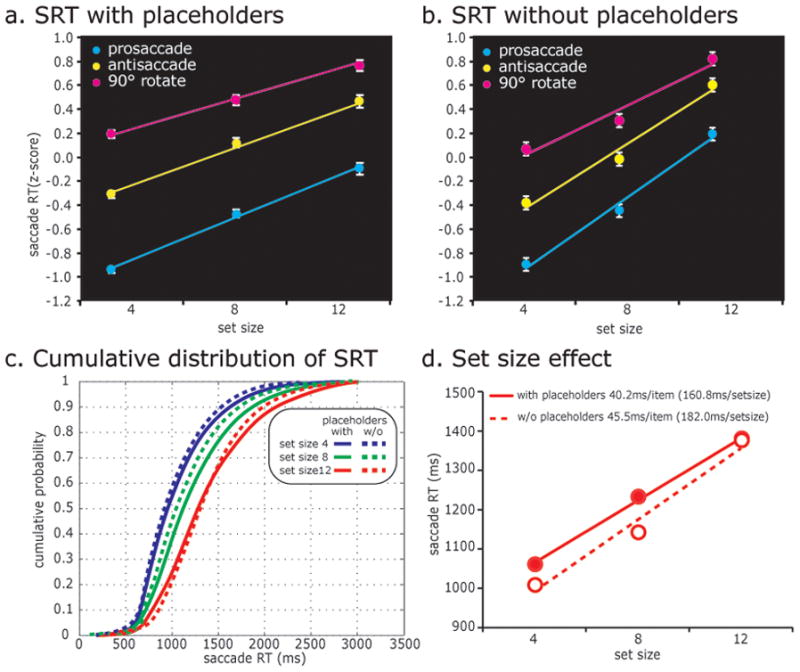
Behavioral data. The average saccadic response time (SRT) data across all subjects in (a) the placeholder (N=18) and (b) no placeholder (N=4) conditions. Each subject’s SRT was converted into z-scores before averaging. Error bars are SEM. Note the positive linear increase in SRT as a function of set size and saccade transformation. (c) Cumulative distributions of SRT for each set size. The search array comes on at t = 0. Solid lines indicate SRT from the experiment with placeholders and dotted lines indicate SRT from the experiment without placeholders. SRTs for smaller set sizes are faster and the distributions for each set size are similar regardless of the use of placeholders. (d) Set size effect on SRT can be discerned from the positive slopes. Set size slopes are similar with placeholders (solid) and without them (dashed).