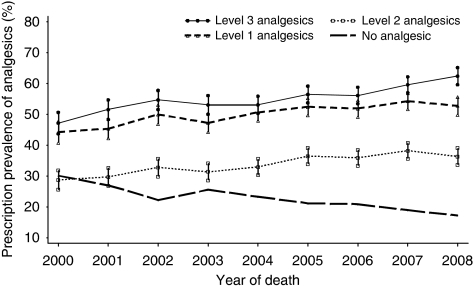
Figure 1.
Time trend of prescription prevalence (95% CI) of level 1, level 2, and level 3 analgesics (according to the WHO analgesic ladder) in patients with lung cancer and proportion of patients without analgesic prescriptions during the last 3 months of life, 2000–2008 (n=10 202). Annual change: level 1: 1.2% (95% CI: 0.8–1.6%, P=0.001); level 2: 1.1% (95% CI: 0.8–1.5%, P<0.001); level 3: 1.5% (95% CI: 1.1–2.0%, P<0.0001); No prescription: −1.4% (95% CI: −1.8 to −1.0% P<0.001).

