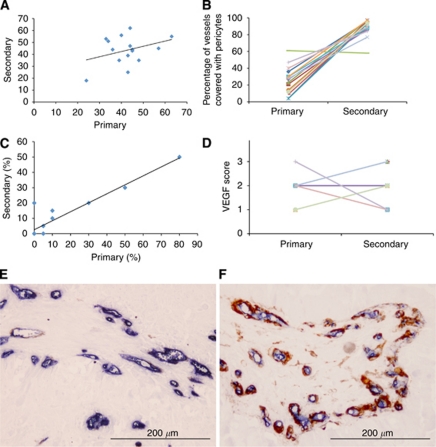
Figure 1.
(A) A scatter plot of CD34 Chalkley counts in matched primary (lung) and secondary (brain) cancers. (B) A line plot showing differences in the percentage of blood vessels covered by pericytes in matched primary and secondary cancers. (C) A scatter plot of the percentage of matched primary and secondary cancers positive for carbonic anhydrase 9. (D) A line plot showing differences in the VEGF score in matched primary and secondary cancers. (E, F) Double-labelled immunohistochemistry for CD34 (blue) and smooth muscle actin (brown) in a matched primary (E) and secondary (F) cancer.

