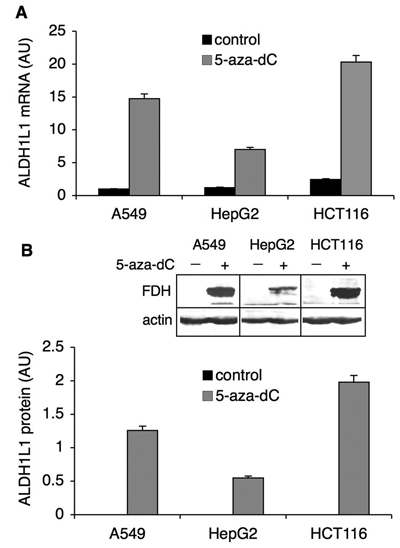
Figure 3.

Reversal of ALDH1L1 silencing by 5-aza-dC. Levels of ALDH1L1 mRNA (A) and protein (B) before (control) and after the treatment with 5-aza-dC (1 µM). Levels of mRNA were measured by real-time PCR (normalized to β-actin mRNA and presented relative to the untreated control). Protein levels were quantified from Western blot assays (inset) and normalized to β-actin levels as a loading control. Average ± SD of 3 independent experiments is shown. AU = arbitrary units.
