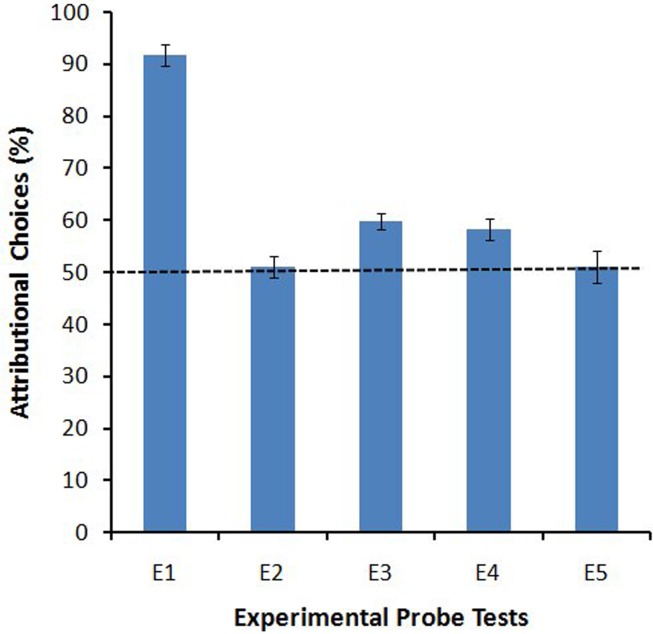
Figure 4.
Mean percent of choices to comparison stimulus that was an attributional match (E1, E5), attributional plus relational match (E2, E4), relational match (E3) to the sample on probe test trials. Error bars depict standard errors. The dashed line indicates chance level of performance. “E1” is Experiment 1, “E2” is Experiment 2, “E3” is Experiment 3, “E4” is Experiment 4, and “E5” is Experiment 5.

