Fig. 3.
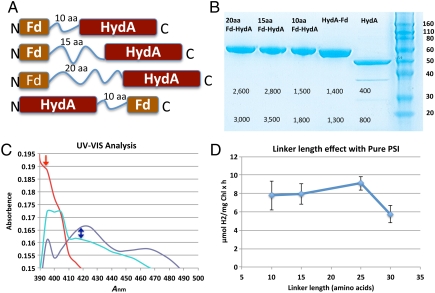
Properties of the ferredoxin-hydrogenase fusion proteins. (A) Designs of fusion constructs showing the Fd and HydA orientations and aa linker lengths. Only 10–20 aa are shown. (B) SDS-PAGE of purified Fd-HydA fusions. Labels from right to left: protein size markers in kDa (Right); HydA, native C. reinhardtii HydA; HydA-Fd, a fusion of the HydA C terminus to the Fd N terminus with a 10-aa linker; Fd-HydA fusions of Fd C terminus to HydA N terminus with a 10-, 15-, or 20-aa linker (Left), respectively; only 10–20 aa are shown. The numbers below the protein bands represent the hydrogen production activities from the MV-sodium dithionite assay. Two values are shown for each enzyme, the specific activity in U units (Upper) and whole-cell activity (Lower) in units of nmol H2 ml-1 min-1. (C) UV-visible spectra of oxidized proteins, Fd (dark blue), HydA (red), and Fd-HydA (cyan). Fd shows a peak at approximately 421 nm, indicating the presence of the [2Fe-2S] cluster (marked by blue arrow). In contrast, HydA has a maximum at 395 nm (marked by red arrow) corresponding to the oxidized [6Fe-6S] H-cluster. The spectra of Fd-HydA show both a broader 395-nm peak of the H-cluster with a more intense 421-nm region that arises from the presence of the Fd [2Fe-2S] cluster. (D) The effect of linker length on the rate of hydrogen production in reactions with purified plant PSI and each of the Fd-HydA fusion proteins.

