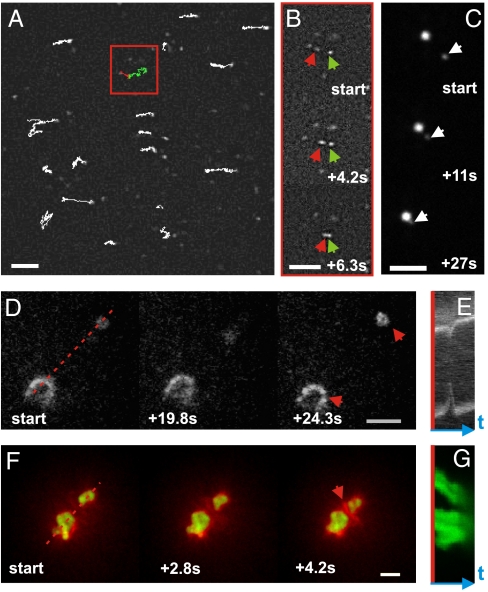
Fig. 2.
Dynamics of actin/myosin coalescence. (A) Trajectories of myosin filaments moving on an actin network (1∶200 myosin∶actin; 3 min after sample preparation). Red and green traces represent two filaments that coalesce after an active walk. Scale bar 5 μm. (B) Time-lapse image sequence of coalescing myosin filaments corresponding to the green and red traces (see arrows). (C) Time-lapse image sequence of two fusing myosin foci. (D) Time-lapse image sequence of two actomyosin condensates (red arrows, actin labeled) undergoing a contractile fluctuation (1∶200 motors). Scale bar, 10 μm. (E) Kymograph constructed along red dashed line in (D). (F) Time-lapse image sequence of two actomyosin aggregates that coalesce and accumulate actin between them (red arrow, 1∶50 myosin∶actin). Scale bar, 10 μm. (G) Kymograph constructed along red dashed line in (F).

