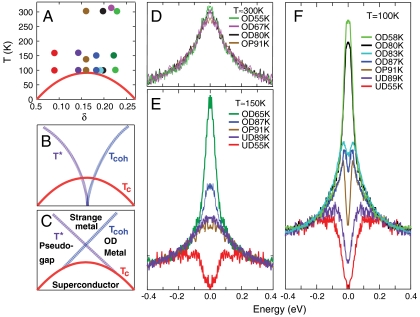
Fig. 1.
Spectra at constant temperature as a function of doping. (A) Dots indicate the temperature and doping values of the spectra of the same color plotted in D–F. (B) Schematic phase diagram for a quantum critical point near optimal doping. (C) Schematic phase diagram for a doped Mott insulator. (D) Spectra at T ∼ 300 K for several samples measured at the antinode, where the d-wave superconducting gap below Tc is largest. The spectra are normalized to high binding energy and symmetrized in energy to eliminate the Fermi function. The doping values are indicated by the top row of dots in A. (E) Same as in D, but at T ∼ 150 K, with the dopings indicated by the middle row of dots in A. (F) Same as in D, but at T = 100 K, with the dopings indicated by the bottom row of dots in A.

