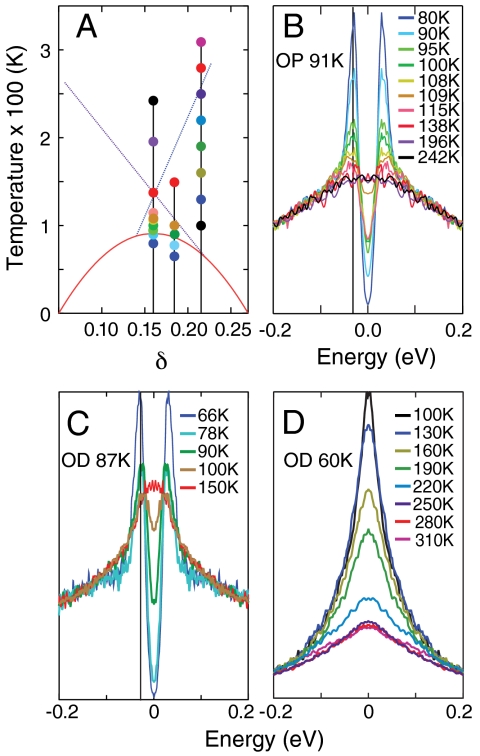
Fig. 2.
Spectra at constant doping as a function of temperature. (A) Dots indicate the temperature and doping values of the spectra of the same color plotted in B–D. (B) Symmetrized antinodal spectra for two optimally doped samples (δ = 0.16). The temperature values are indicated by the left row of dots in A. (C) Same as in B, but for a doping of δ = 0.183, with the temperatures indicated by the middle row of dots in A. (D) Same as in B, but for a doping of δ = 0.224, with the temperatures indicated by the right row of dots in A. Gray lines in B and C mark the location of the gap.

