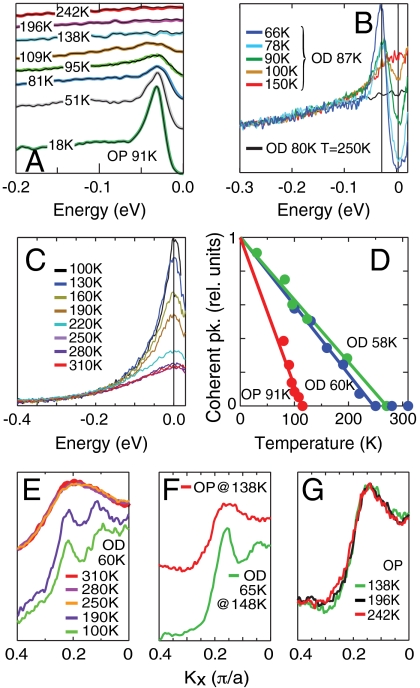
Fig. 3.
Fermi function divided spectra. (A) Antinodal spectra for two optimally doped samples, δ = 0.16, showing sharp peaks with an energy gap (green curves) below T∗, but broad gapless spectra (purple curve) above T∗. Colored lines show Fermi function-divided data, with symmetrized data superimposed as sharp black lines. (B) Spectra for an overdoped sample, δ = 0.183, showing that, unlike in A, the spectral gap is lost above 100 K, whereas the sharp peak persists to higher temperature. (C) Data for an overdoped δ = 0.224 sample. The sharp spectral peak decreases in intensity with increasing temperature. By T = 250 K, the spectral line shape is broad and temperature independent. (D) Linearly decreasing intensity of the sharp spectral peak relative to the broad Lorentzian with increasing T for three values of δ. Tcoh is where this intensity reaches zero. (E) Momentum distribution curves (MDCs) for an overdoped δ = 0.224 sample, showing that a qualitative change in spectral shape occurs near Tcoh. (F) Comparison of the MDC of an OP doped sample, to that of an OD sample at a similar T. (G) T-independence of the spectral shape for an OP sample above Tcoh.

