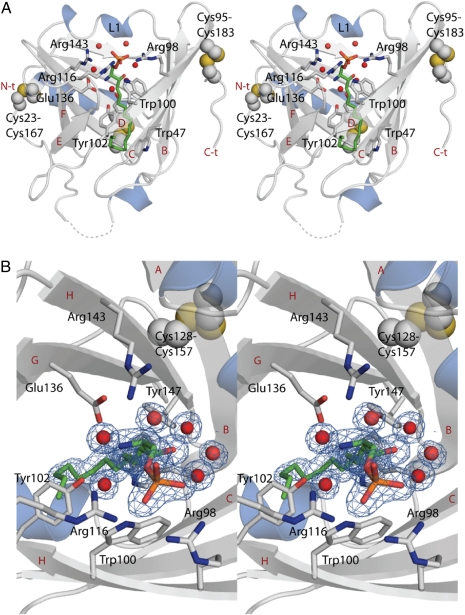
Fig. 1.
The structure of the ApoM–S1P complex reveals the determinants of S1P-binding specificity. (A) Stereo view of the crystal structure of apoM with S1P at 1.7-Å resolution. S1P is shown as green sticks together with interacting residues. Strands B–F, the N terminus (N-t), and the C terminus (C-t) are labeled in red, and the interacting residues are labeled in black. (B) Top view of the S1P-binding site in close up. Electron density for S1P and surrounding water molecules is contoured at 1 σ and colored blue. Water molecules are shown as red spheres in both panels, and unmodeled loops toward the N terminus are shown as broken lines.

