Fig. 1.
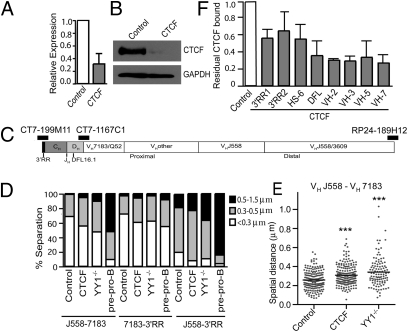
CTCF knockdown results in decreased Igh locus compaction. (A) RNA expression in CTCF knockdown and control (scramble shRNA) Rag1−/− pro-B cells. Data are presented as mean ± SEM (n = 3). (B) Western blot of CTCF in CTCF knockdown and control pro-B cells. GAPDH served as a loading control. (C) Diagram of Igh locus indicating the position of the BAC probes. (D) Igh locus contraction as measured by 3D-FISH in CTCF knockdown and control pro-B cells. YY1−/− pro-B and E2A−/− pre–pro-B cells were also analyzed. The graph represents the percentage of alleles with spatial distances within three ranges: <0.3 μm, 0.3–0.5 μm, and 0.5–1.5 μm. (E) Dot plots showing distribution of spatial distances between VHJ558 and VH7183 probes. For CTCF knockdown, control, and YY1−/− pro-B cells, 204, 202, and 106 alleles, respectively, were analyzed. ***P < 0.0001 in comparison to control pro-B cells. (F) CTCF ChIP in CTCF knockdown and control pro-B cells. Data are presented as mean ± SEM (n = 2).

