Fig. 4.
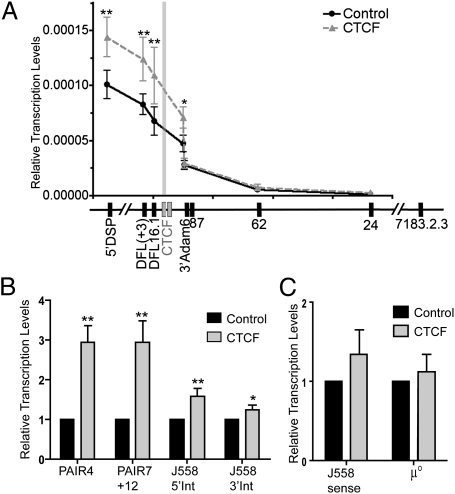
CTCF knockdown affects the level of antisense transcription in the Igh locus. (A) Relative antisense transcription levels as measured by quantitative PCR (qPCR) of cultured Rag1−/− pro-B cells transduced with control or CTCF shRNAs. The DFL(+3) primer target is located 3 kb downstream of the DFL16.1 gene. The 5′DSP primer targets are located 0.4 kb upstream of the DSP genes. The 24, 62, and 87 primers are located 24, 62, or 87 kb downstream of VH7183.2.3 (81×). The gray bar indicates the relative location of the CTCF/DFL sites. Results are normalized to mouse 18S RNA and are presented as mean ± SEM (n = 6). (B) Relative antisense transcription levels in the VHJ558 region as measured by qPCR of CTCF knockdown and control Rag1−/− pro-B cells. Results are presented as mean ± SEM (n = 5). (C) Sense transcription levels from J558 region and μ° were measured by qPCR on CTCF knockdown and control Rag1−/− pro-B cells. Results are presented as mean ± SEM (n = 4). In comparison to control pro-B cells: *P < 0.075; **P ≤ 0.05 (details in Table S7).

