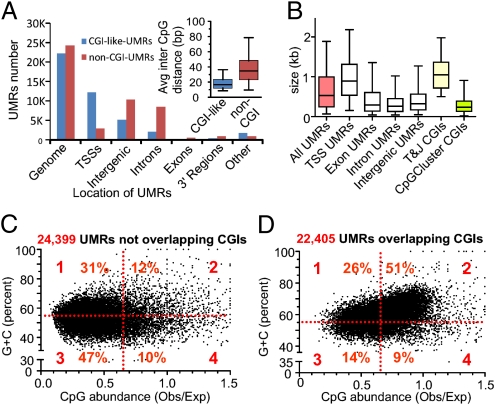
Fig. 5.
CGI-like and non-CGI UMRs as detected genome-wide in the mouse liver genome. (A) Distribution of UMRs in the major genomic compartments: TSS regions (−3 Kb to +2 Kb of the TSS) and 3′ region of genes (3 Kb). For this segmentation, the RefSeq definition of genes was used. If a UMR is not completely included in one of the five categories, it was labeled as “other.” UMRs were classified as overlapping or not in the combined set of CGIs (T&J, GG&F, or CpGCluster). (Inset) Distributions of the average inter-CpG distance calculated for each UMR, represented as box-and-whisker plots depicting the median, quartiles, and fifth and 95th percentiles. (B) Size distribution of UMRs and comparison with CGIs. Box-and-whisker plots (median, quartiles, and fifth and 95th percentiles) represent the distribution of sizes for UMRs that were completely included in the indicated genomic regions. (C and D) Scatter plots represent the (C + G) content vs. Obs/Exp CpG ratio in UMRs that overlap and do not overlap CGIs. Note the large proportion of UMRs that do not meet CGI criteria. Obs/Exp, observed/expected.

