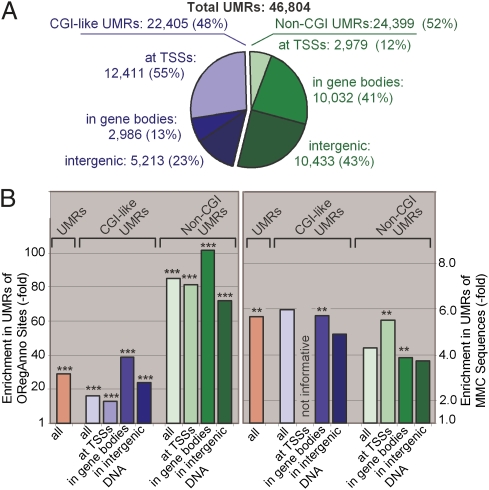
Fig. 6.
Genomic distribution of UMRs and enrichment of annotated features. (A) Distribution of CGI-like and non-CGI UMRs in genomic regions. UMRs at TSS regions (−3 kb to +2 kb of TSS), in gene bodies (non-TSS exons, introns, and +3 kb of 3′ not-transcribed regions), and in intergenic DNA do not add up to 100 because only those UMRs with >90% overlap were considered. (B) Enrichment of ORegAnno sites and MMC sequences in the UMRs located in the indicated genomic regions. Enrichments are compared with abundance in the undiluted genome (numerical values are provided in SI Appendix, Table S12). **P < 0.005; ***P < 0.0001.

