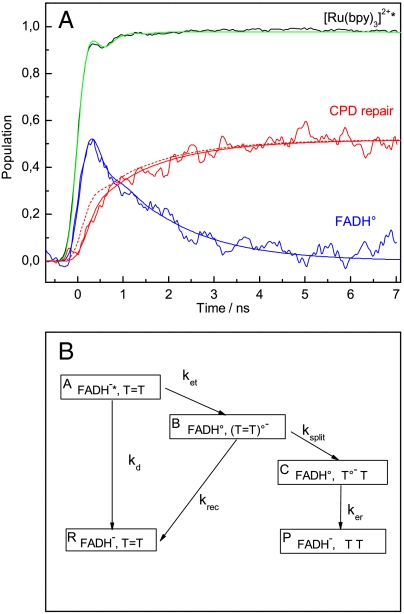
Fig. 3.
Modeling of the experimental population kinetics of FADH∘ and of T = T repair. (A) Noisy blue and red traces: population kinetics of FADH∘ and of T = T repair (restoration of thymine pairs) deduced from experimental data as outlined in the text and in the SI Text. Black trace: transient absorption signal for Ru(bpy)3Cl2 from Fig. 2D scaled to unity amplitude. The four smooth traces are convolutions (see SI Text) of the instrument response function (SI Text) with the following model kinetics: Blue and red solid traces: population kinetics of FADH∘ and of CPD repair, respectively, according to the reaction scheme presented in B with kd = (1.25 ns)-1, ket = (0.1 ns)-1, krec = (0.35 ns)-1, ksplit = (0.26 ns)-1, ker = (1.55 ns)-1. Red dashed trace: same as red solid trace, except that ksplit = (1 ps)-1, and that the amplitude was scaled down by a factor of 0.58. Green trace: step function with unity amplitude. (B) Kinetic scheme used to model the experimental results. Analytical expressions for the population kinetics according to this scheme are presented in SI Text.

