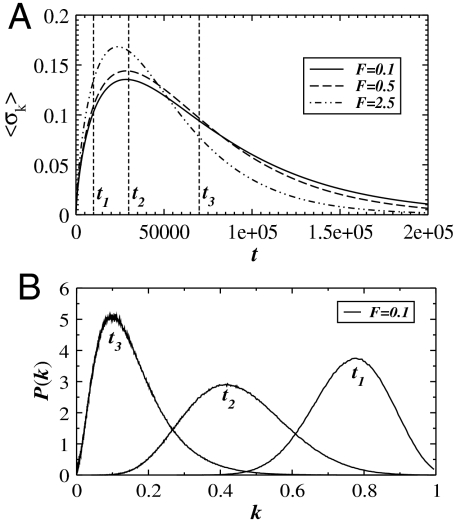
Fig. 3.
(A) The standard deviation 〈σk〉 of the local spring constants k as a function of time for three values of F = 0.1, 0.5, 2.5 and Np = 512. In panel B, we plot the distribution of spring constants P(k) at time points ti (i = 1, 2, 3) as indicated in panel A for F = 0.1. In both graphs, we use the parameters Δp = 0.20 and poff = 0.5.

