Fig. 5.
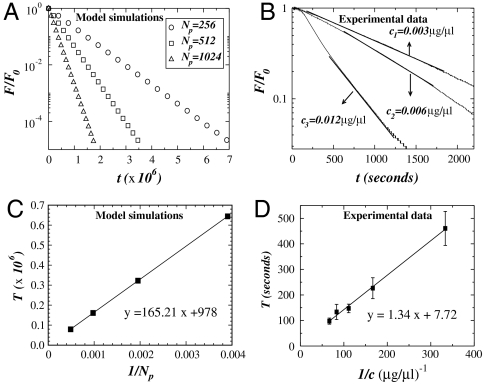
Linear-log plot of the force normalized by the initial force F0 as a function of time for both simulations and experiments. In panel A we show the force calculated by numerical simulations in a network composed of fibers arranged in a Voronoi network. All curves present an exponential decay with a time constant that depends on the number of particles Np. In panel B we show experimental results for the measured force in three elastin sheets. All curves show an exponential decay with a time constant that depends on enzyme concentration. For the numerical results, F0 corresponds to the estimated value obtained from the numerical fit of the data calculated for a single fiber, whereas for the experimental data, F0 is the value of the force measured before addition of enzyme. In panels C and D we plot the time constant T as a function of the inverse of the number of particles Np and enzyme concentration c, respectively. In the simulations, the time constant T is measured in time step and calculated with different initial configurations of the Voronoi network, averaged over 10 runs. The error bars are smaller than the symbol. The experimental time constant T has units of seconds and was obtained from the average over five different experiments for each concentration. The error bars increase as the concentration decreases. In both panels C and D, the solid lines represent the best linear fit to the data with R2 values of 0.999 and 0.998, respectively.

