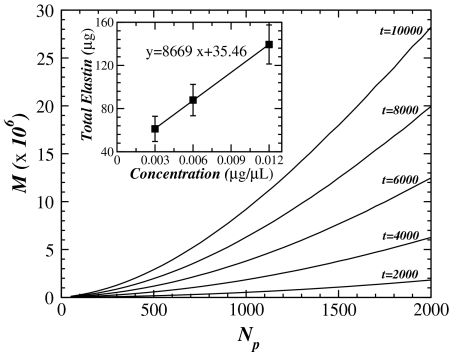
Fig. 6.
The main panel shows the amount of mass M as a function of the number of particles Np. The M represents the sum over all fragments released from the fiber during the digestion process and calculated from numerical simulations on a single fiber. Each solid line corresponds to the increase in M with particle concentration for different fixed time points t during the digestion process. The inset shows the results from experiments: the fragment mass M released into the bath at the end of 60-min digestion with three different elastase concentrations (0.003, 0.006, and 0.012 μg/μL). Each point was obtained from analysis of at least five samples for each concentration. The solid line represents the best linear fit to the data with an R2 value of 0.999.

