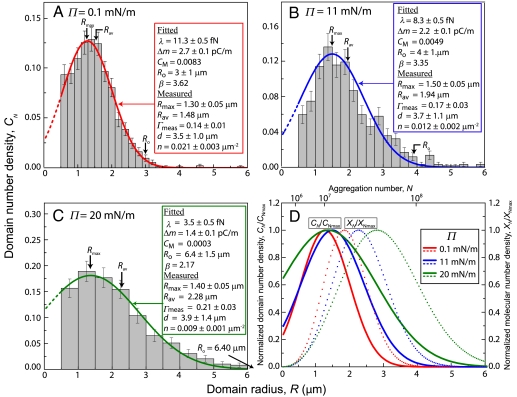
Fig. 2.
Experimentally determined fraction of domains of a given radius, CN, as a function of domain radius, R, of control CYT myelin monolayers at three different surface pressures,  : (A) 0.1 mN/m, (B) 11 mN/m, and (C) 20 mN/m determined from the fluorescence images in Fig. 1 A–D displayed as histograms. The solid curves are the theoretical distributions (Eq. 8) fit to the histograms. The fitting parameters Ro, CM, and β are listed in the inset. From Ro and β, both Δm = (4ϵϵokBTβ/Ro)1/2 and λ = (kBTβ/πRo)· ln[4Ro/e3δ] were evaluated. The mean domain radius, Rav, the measured area fraction of domains,
  , the mean distance between neighboring domains, d, and the number density of domains, n, taken directly from the images are listed along with Rmax, the maximum in the fitted theoretical size distribution. (D) Comparison of the three fitted curves in (A)–(C) plotted both in terms of the normalized domain concentrations CN/CN max (solid curves, A–C), as well as in terms of the molecular number densities XN/XN max (dotted curves), where XN = NCN.

