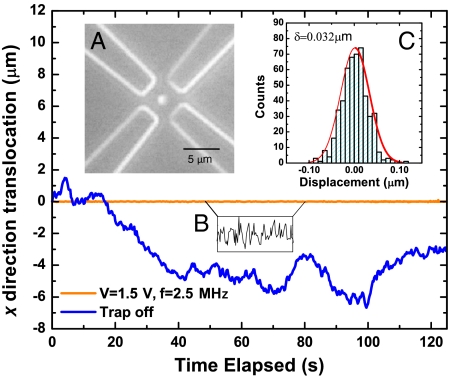
Fig. 2.
Particle trajectories when the trap is on (orange line) and off (blue line) in the x direction. Inset A shows a snapshot of a single particle confined in the center of the device. Inset B shows a magnification of fluctuations. Inset C is the histogram of the displacements for the orange curve. A Gaussian fit yields a trap stiffness of 4 pN/μm.

