
Fig. 3.

Effect of the applied voltages and frequencies on the confinement of particles. Experiments are performed with 491-nm radius particles and R0 = 4-μm devices. No dc voltages are applied (U = 0). (A) The x-y positions of a single particle trapped under a fixed frequency (f = 3 MHz) and three different voltages. (B) Radial probability histograms (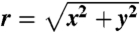 ) corresponding to the datasets in A. P(r) is defined such that ∫P(r)2πrdr = 1. (C) The x-y positions of a single 490-nm radius particle trapped under a fixed voltage (V = 1.2 V) and three different frequencies. (D) Radial probability histograms corresponding to the datasets in C.