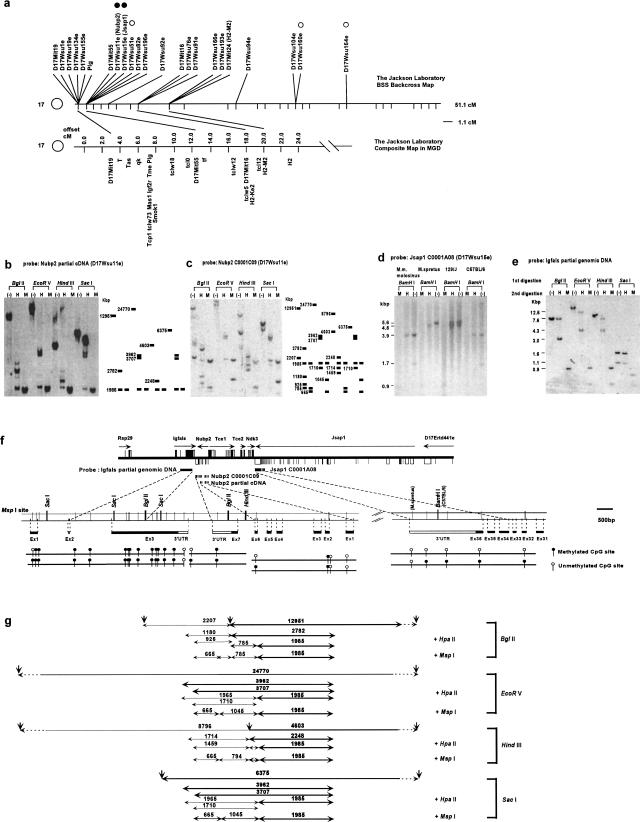
Figure 1.
DNA methylation assay. (a) Genetic map of chromosome 17 on the Jackson Laboratory BSS backcross panel (top) compared with the composite map of t complex region with important landmarks (bottom). Open circles indicates a gene whose methylation status was examined, but did not show partial methylation pattern. Filled circles indicate genes that show partial methylation patterns. (b–d) Southern blot of 129SV/J mouse genomic DNA digested first with BglII, EcoRV, HindIII, and SacI, followed by the second digestion with HpaII (H), MspI (M), and no digestion (–). (b) A 531-bp cDNA fragment containing exons 1–5 of Nubp2 was used as a probe. The schematic diagram with DNA fragment sizes (bp) is shown (right).(c) A 1378-bp cDNA fragment (a full-length C0001C09 clone) containing exons 1–7 of Nubp2 was used as a probe. The schematic diagram with DNA fragment sizes (bp) is shown (right). (d) Southern blot of M. musculus molosinus, Mus spretus, 129SV/J, and C57BL/6J mouse genomic DNAs, digested first with BamHI, followed by the digestion with MspI (M), HpaII (H), and no digestion (–). A 2046-bp cDNA fragment containing exons 36–34 of Jsap1 was used as a probe. (e) A 2141-bp HindIII–EcoRI genomic DNA fragment containing exon 3 of Igfals was used as a probe. (f) A schematic organization of genes (Rsp29, Igfals, Nubp2, Tce1, Tce2, Ndk3, Jsap1, and D17Ertd441e) on the completely sequenced BAC clone (126c8: [Kargul et al. 2000]) and the location of the DNA probes, which were used for the DNA methylation assay (top). Black box indicates coding exon and white box indicates noncoding exons (Kargul et al. 2000). A magnified view of the exon–intron structures for Igfals, Nubp2, and Jsap1, with the restriction enzyme sites of MspI, BglII, SacI, HindIII, and BamHI, is also shown (middle). Positions of polymorphic MspI site in the 3′-UTR of Jsap1 are indicated by the mouse strain name in parentheses. Methylation status (methylated, black circle; unmethylated, white circle) of each MspI site deduced from Southern blot analyses (b–e) are shown (bottom). (g) To correlate Southern blot results (b–e) to the methylation status of the MspI site (f), expected genomic fragments and their sizes (bp) are shown. Bold letters and lines indicate the DNA fragments in (c), and the others indicate the DNA fragments in (e).

