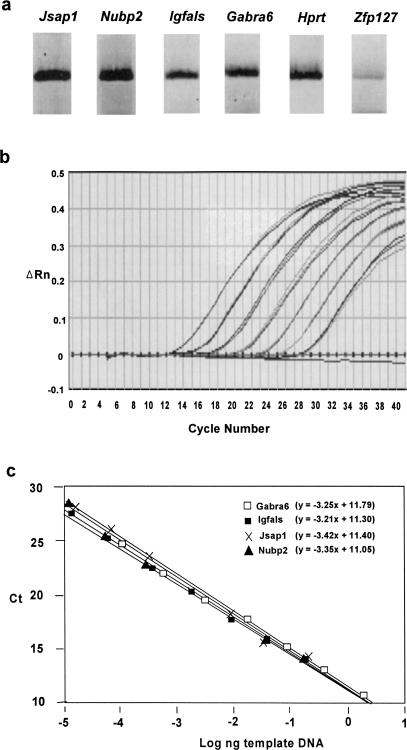
Figure 4.
Quantitation of gene expression levels. (a) RT-PCR products from cell clones, which were used to perform a SNuPE assay for each gene. (b) Normalized reporter signal (ΔRn) versus cycle number is plotted for the input of Jsap1 template ranging from 3.2 × 10⁻⁴, 1.6 × 10⁻³, 8 × 10⁻³, 4 × 10⁻², 2 × 10⁻¹, 1, and 5 ng. The amplification curves represent the highest to lowest PCR products from left to right. Three replicates for each point are performed with no template control shown at the baseline through 40 cycles. (c) The standard curves of Igfals, Nubp2, Jsap1, and Gabra6. Ct versus log nanograms of the template input is plotted.

