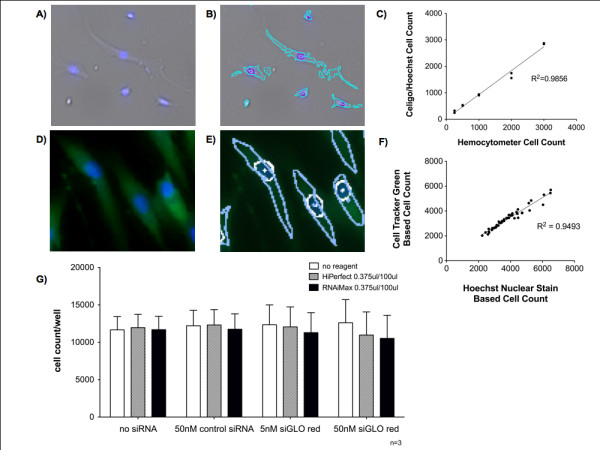
Figure 2.

Cell counts of live adherent human AoSMCs in cell culture using Celigo® cytometer. (A) Overlay of AoSMC brightfield and DAPI filter images (Hoechst nuclei stain, blue). (B) Segmentation of AoSMCs seen in (A) and their nuclei. For the detection specific gating parameters were adjusted for the Celigo® cytometer. Although suboptimal brightfield segmentation (light blue borders) was observed when gating the individual AoSMCs, the Celigo® system segmented the nuclei (purple borders) accurately due to their homogenous shape and strong fluorescence signal and thus provided a precise total cell count. (C) Correlation between cell counts obtained by a hemocytometer and the Celigo® cell count based on Hoechst nuclei stain. (D) AoSMCs dual labeled with Hoechst nuclei stain and cytoplasmic dye Cell Tracker Green. (E) Overlay of fluorescence channels with gated nuclei (white line) and cytoplasm border (light blue line) overlapping. (F) Individual stain counts (blue, DAPI filter and green, FITC filter) compared in dual labeled cells with Hoechst nuclei stain (blue) and the cytoplasmic dye Cell Tracker Green (green). (G) AoSMC counts were not significantly different between the individual treatment conditions.
