
Figure 7.
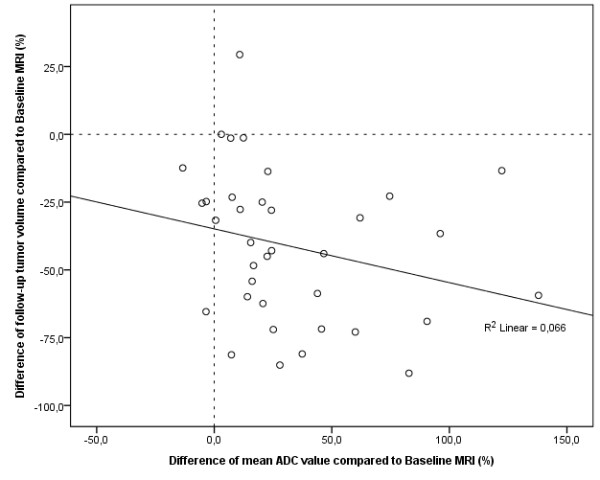
Scatter plot depicting the relationship between changes of mean tumor volume and mean tumor ADC at follow-up MRI compared to baseline MRI. Scatter plot depicts the relationship between changes of mean tumor volumes and mean ADC values of colorectal liver metastases 3 months after treatment with HDR-BT as compared to baseline MRI. A decrease in tumor size is inversely associated with an increase in ADC. Pearson's correlation indicated a weak but statistically significant linear relationship of r = -0.257 (p < 0.001).