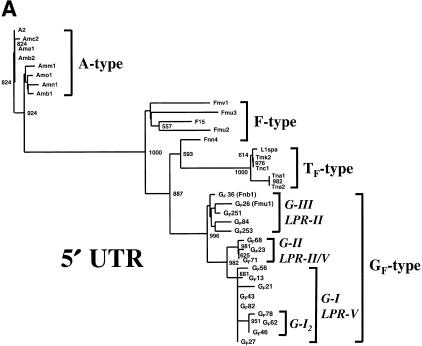
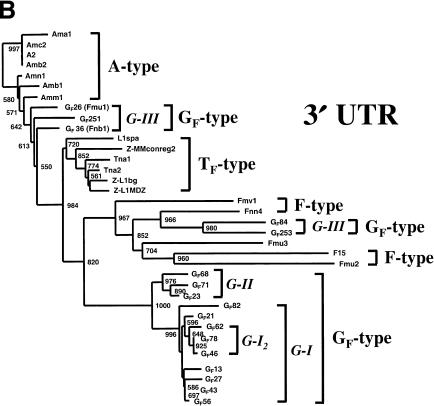
Figure 3.
(A) Phylogenetic analysis of that portion of the 5′ UTR of mouse L1s defined as region α by Mears and Hutchison (2001) and corresponding to nucleotides 1539–1740 of the A-type element L1Md-A2. The unrooted tree was constructed by the nearest neighbor-joining method (Saitou and Nei 1987) and includes the 17 members of the GF dataset and members of the dataset used by Mears and Hutchison (2001). GF clades identified by the analysis are named G-I, G-II, and G-III, and their corresponding LPR groups are indicated. Significant bootstrap values (of 1000 replicates) are shown at the nodes. (B) Phylogenetic analysis of 3′ UTR region corresponding to nts 6701–7333 of L1MdA2. Also included in this analysis are L1s classified by Hardies et al. (2000) as members of the “Z subfamily”: MMconreg2, L1bg (Perou et al. 1997), and L1MdZ (Kraft et al. 1992). These group with TF-type elements.


