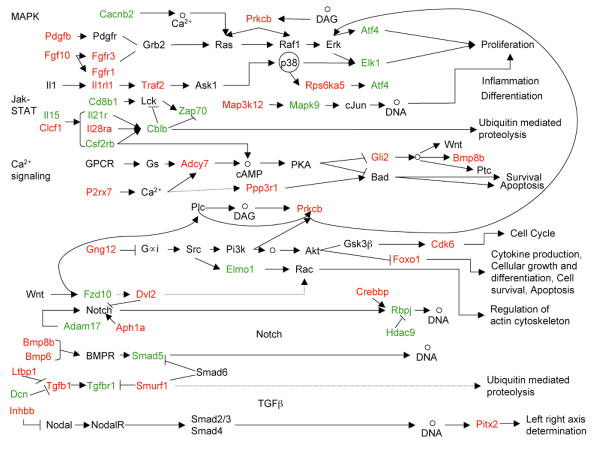
Figure 10.
Schematic summary of dysregulated signalling pathways in Pkd1-/- model. The figure shows aberrant change in signalling pathways in Pkd1-/- mouse model. Up-regulated genes are shown in red and down-regulated genes in green. Genes that were not differentially expressed are shown in black. Circles designate chemical compounds and DAG stands for diacylglycerol.

