
Figure 2.
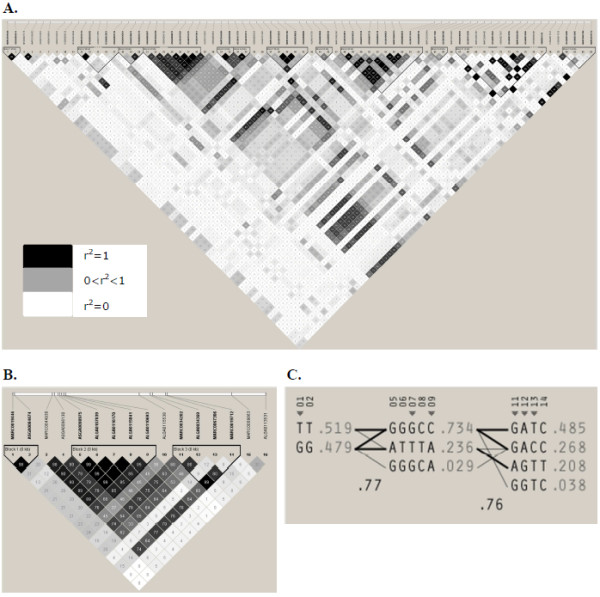
LD analyses of all 16 significant SNPs (p≤0.05 after FDR), intervening SNPs and haplotypes for the significant SNPs. The values in the boxes are pair wise SNP correlations (r2) and boxes without numbers indicate SNPs in complete LD. The 16 significant SNPs are shown in B. Haplotypes for these 16 SNPs are shown in C. Each line represents a haplotype and the frequency of the haplotype in this population is given at the end of the line. Haplotypes with a frequency below 2% are not included.