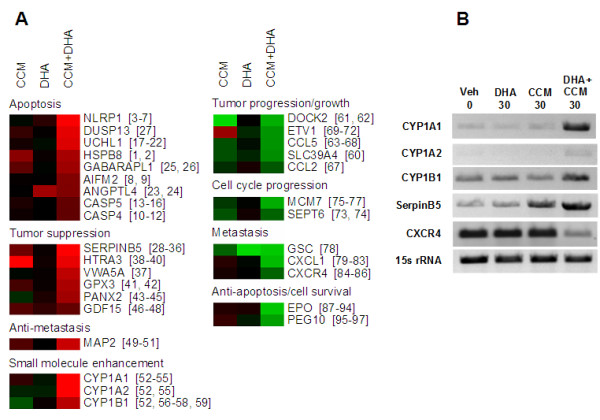
Figure 3.

Transcripts of functional importance relative to the synergistic antiproliferative effect of the curcumin/DHA combination. (A) All genes are labeled according to current HGNC symbols. Numbers to the right of gene symbols indicate references in a separate transcript annotation bibliography (see Additional file 8). Fold-change and associated P values corresponding to this figure can be found in Additional file 9. Heatmap values are log2-transformed, normalized fluorescence ratios for untreated versus treated cells (see methods), with green indicating upregulation and red indicating downregulation relative to untreated SK-BR-3 cells. All responses shown for DHA+CCM were 2-fold or greater, p < 0.01, on three replicate arrays. For the purpose of visual comparison within a heatmap format, values for non-significant responses are mean normalized fluorescence ratios from three replicate arrays. For genes represented by more than one chip feature in the Agilent platform, mean normalized fluorescence ratio was retrieved for the feature producing the lowest mean P value. As such, some responses in this figure appear greater than 2-fold but were not significant according to the criterion p < 0.01. (B) RNA was isolated from SK-BR-3 cells treated with 30 μM DHA, μM CCM, or a mix of 12 μM CCM+18 μM DHA. RT-PCR was performed for selected genes in order to validate the microarray data. Results are representative of three separate experiments.
