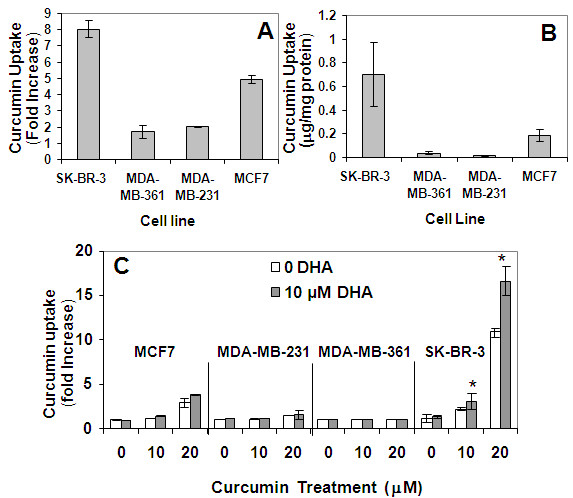
Figure 6.

Effect of DHA on CCM uptake. Cells were treated with 20 μM CCM for 24 hours. CCM uptake was quantified by flow cytometry (A) in comparison with HPLC (B) as described in Materials and Methods. (C) SK-BR-3, MDA-MB-231, MDA-MB-361, MCF7, and MCF10AT cell lines were treated with escalating doses of CCM in the presence or absence of 10 μM DHA and analyzed by flow cytometry. Fold changes (A, C) were compared to respective cell line controls (without CCM or DHA). *P < 0.05 for Student's t-tests comparing the treatments with DHA to the treatments without DHA in three duplicate assays.
