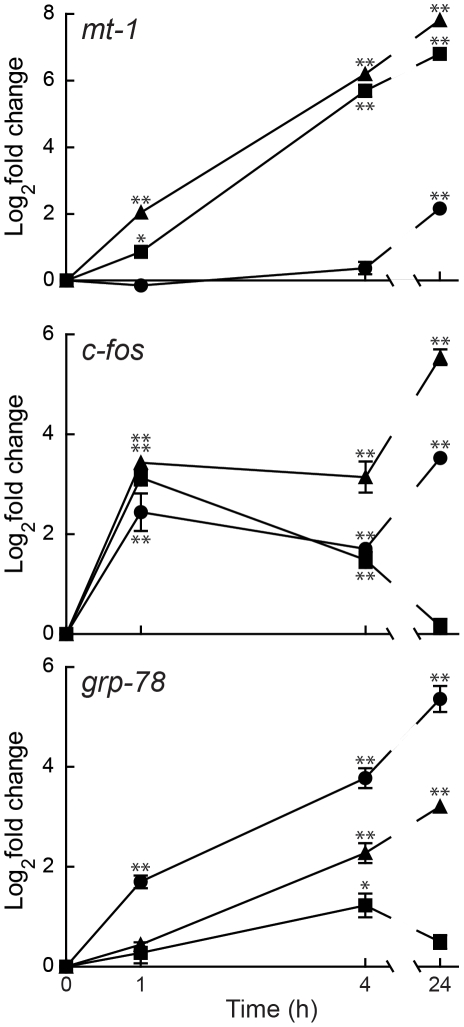
Figure 1. Effects of cadmium and thapsigargin on transcription.
Total RNA was isolated from HEK293::YC3.60 cells exposed to either 1 µM (square) or 30 µM (triangle) cadmium, or 2 µM thapsigargin (circle) for 1, 4, or 24 h. Steady-state mRNA levels of mt-1, c-fos, and grp-78 were measured using qRT-PCR. All measurements were normalized to mRNA levels of actin. Fold change was normalized to mRNA levels observed in control cells. Results were mean log2fold change ± SEM (n = 3) and were analyzed by one-way ANOVA followed by Dunnett's post-test; single (*) and double (**) asterisks indicate significant differences from controls at p<0.05 and p<0.001, respectively.

