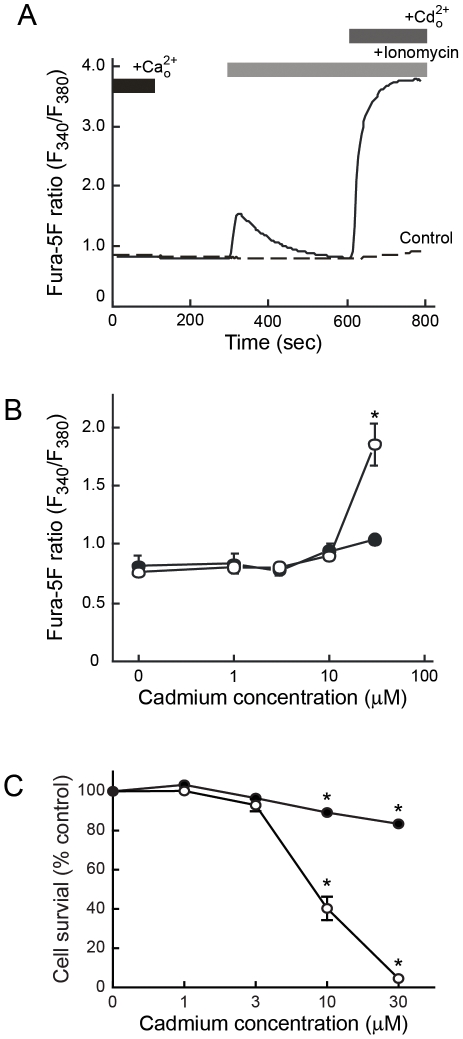
Figure 2. Cadmium uptake and cell viability in HEK 293::YC3.60 cells.
A, Fura-5F loaded cells were incubated with ionomycin for 10 min to deplete intracellular calcium stores and then 2 mM cadmium in calcium-free HBSS was added to the medium (solid line). In the experiment represented by the dashed line, similar conditions were used except cells were not exposed to ionomycin prior to cadmium addition. Traces are representative of typical responses observed in at least three independent experiments. B, HEK293::YC3.60 cells were exposed to 0, 1, 3, 10, and 30 µM cadmium for 4 (closed circle) and 24 (open circle) h. Following metal exposure, cells were incubated with fura-5F and then fluorescence ratios were determined. Asterisks indicate a significant (p<0.001) difference between control and cadmium exposed groups. Data were analyzed by two-way ANOVA followed by Tukey's post-test. Asterisks indicate a significant (p<0.001) difference between control and cadmium exposed groups. C, Cell viability of HEK293::YC3.60 cells exposed to 0, 1, 3, 10, and 30 µM cadmium for 4 (closed circle) and 24 (open circle) h. Data were expressed as the mean ± SEM and were analyzed by one-way ANOVA followed by Dunnett's post-test. Asterisks indicate significant (p<0.001) difference from control and cadmium exposed groups.

